Product analytics
In short: See how every product is doing: views, carts, orders, revenue, conversion and trend. Find your best sellers and the products that get views but no sales.
- The Products tab of Analytics lists every product with the numbers that matter for it: how many people looked, how many added it to a cart, how many bought, how much it earned and how that is changing.
- Use it to find your best sellers, and the products that get views but no sales.
Video transcript
In this video you will learn how to read your Product analytics page. You will see what each product earned, how many orders it had, and how to open one product's numbers. Nothing on the page is changed. These four numbers add up your products: what they earned, orders, products sold and page views. A dash under conversion means too few visitors so far. Search finds a product by its name. Most earned puts your best sellers first. You can change the order here. Each row is one product, with its status, views, carts, orders and what it earned. View analytics opens the full numbers for that product. The panel on the right shows the same numbers for the selected product. So: read the totals, sort the list, then open one product to see how it sells. Thank you so much for watching PersonaCart. To read the full guide, go to docs dot personacart dot com. To try PersonaCart yourself, go to personacart dot com. And subscribe, so you do not miss the next tutorial.
Where to find it
Sidebar → GROWTH → Analytics → Products.
The list follows the period chosen at the top of Analytics. Analytics is on every plan.
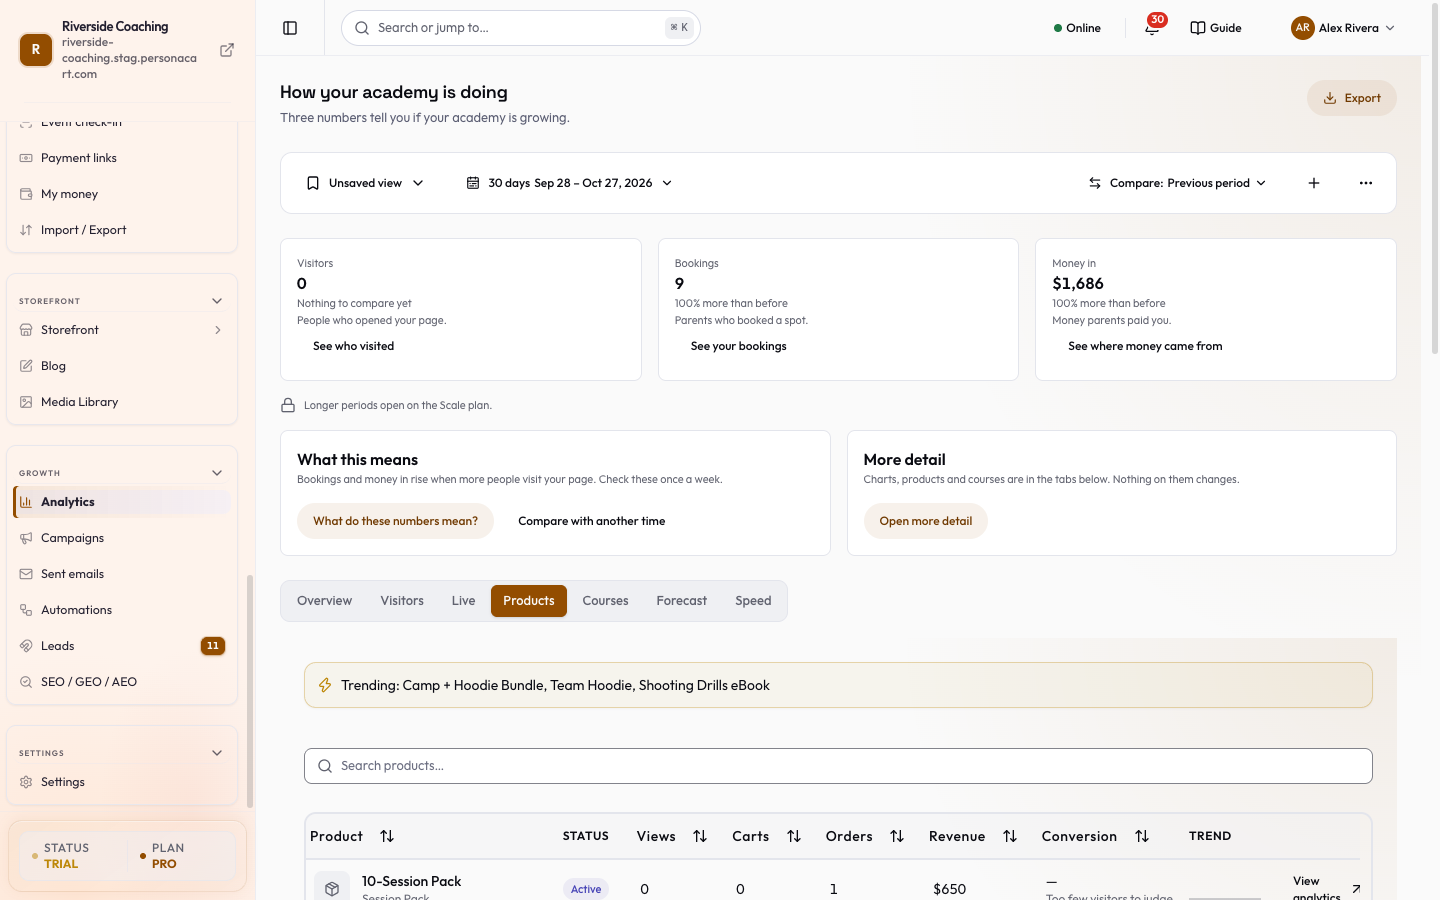
See what is trending
When some products are selling faster than usual, a strip above the list starts with Trending: and names up to three of them.
Read the product list
Four totals sit above the list: what your products earned, orders, products sold and page views. A sort menu (for example Most earned) puts your best sellers first, and you can change the order there.
Use Search products… to find a product by name or type. Press / to jump to the search box and ? to see the keyboard shortcuts for the list.
| Column | What it shows |
|---|---|
| Product | The product name and its type. Press a column heading to sort. |
| Status | The product's status. |
| Views | Views of the product page. |
| Carts | Carts that held the product. |
| Orders | Paid orders that included it. |
| Revenue | Money from those orders (shown as what the product earned). |
| Conversion | The share of its viewers who bought it. It reads Too few visitors to judge when fewer than 20 people viewed it, because a percentage from a handful of people would mislead. |
| Trend | A small chart of its recent sales. It says No trend yet when there is nothing to draw. |
| View analytics | Opens the product's own analytics. Clicking anywhere on the row does the same, and a panel on the right shows the same numbers for the selected product. |
The table shows 20 products per page. On a phone, each product is a card with the same numbers. With no products, the tab says No products found and suggests you create one.
Find the products that need attention
- Press the Views heading to sort by views.
- Look for rows with many Views and low Conversion. Check the price, the photos and the description on the product page, or make an offer.
- Look for rows with many Carts but few Orders. People start to buy and stop. A cart reminder email can help (see Campaigns).
Change the period at the top of Analytics and the list updates.
Questions
Why does Conversion say Too few visitors to judge?
Fewer than 20 people viewed the product in the period. A percentage from so few visits would be misleading, so it waits for more.
Where is the SEO score for a product?
SEO lives in one place, the SEO / GEO / AEO workbench. A product's analytics page links to it.
How do I see one product in detail?
Press View analytics on its row, or press the row itself.
Related
Part of Marketing and Analytics Guides · Product page: PersonaCart features