Course analytics
In short: See who started and finished your courses and how each course and quiz is doing, over 7, 30 or 90 days or all time, with a CSV export. Pro plan.
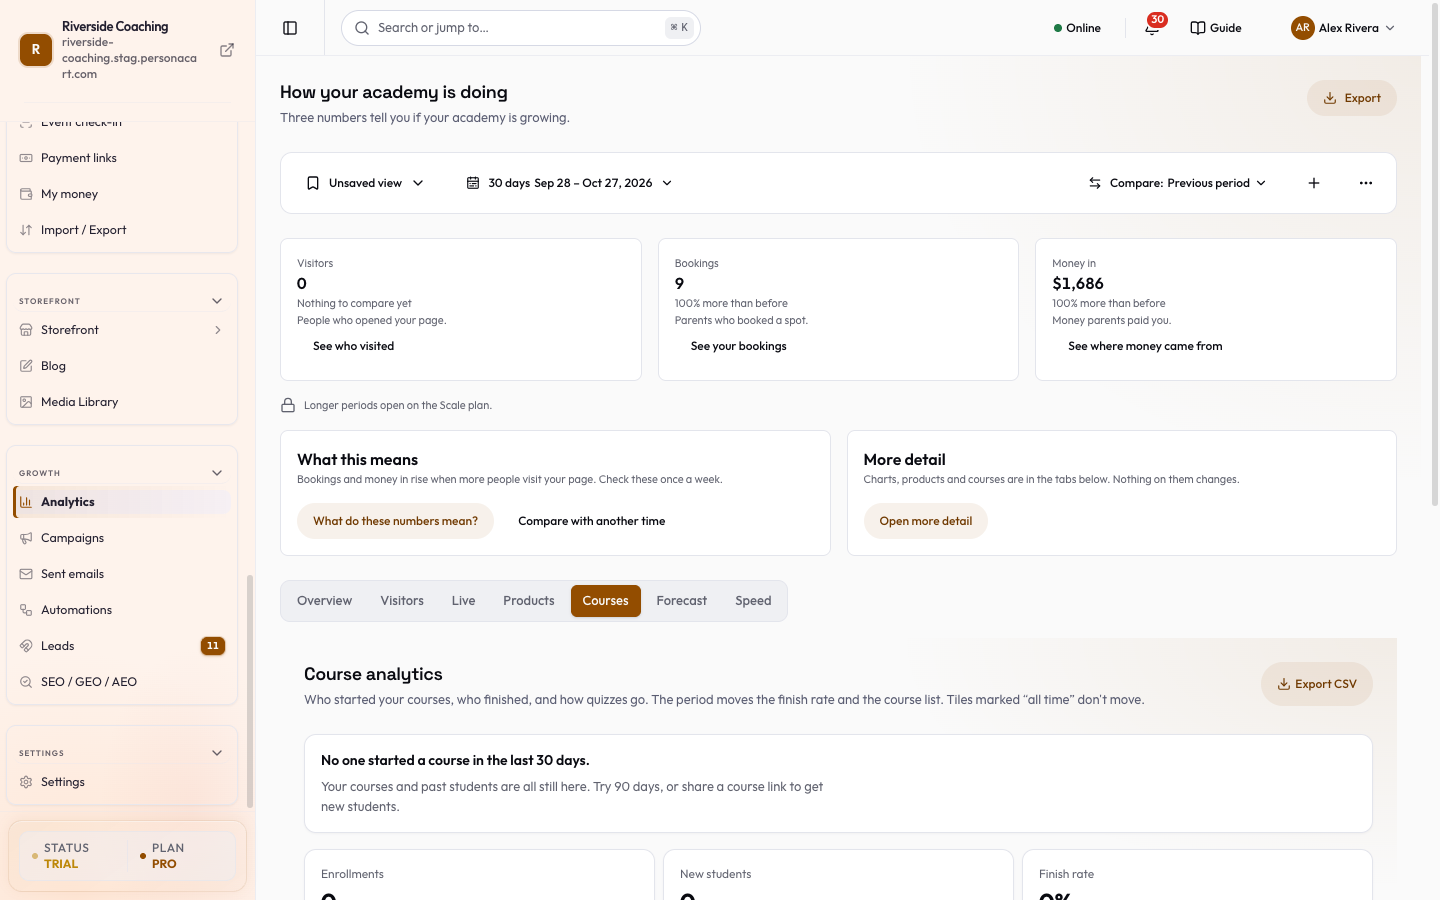
The Courses tab of Analytics shows who started your courses, who finished, and how students do on quizzes. Use it to spot the course that few people finish and the quiz that most people fail.
Where to find it
Sidebar → GROWTH → Analytics → Courses.
The tab shows only when you have courses, or enrollments and certificates from courses you have since deleted. If you open it by link with no courses, you land on the Overview. With no courses at all, the page says You don't sell a course yet and offers Create a course.
Course analytics is on the Pro plan. On Starter the page explains what Pro adds (who started and finished each course, quiz pass rates and average scores, 7, 30 or 90 days with a CSV export) and offers See Pro plan and Compare plans. Your courses and students work the same on every plan.
Pick the days
Inside Analytics the days come from the period bar at the top. On its own address the tab has its own Period buttons: 7 Days, 30 Days, 90 Days and All time. A choice your plan does not open is greyed out and names the plan that opens it. For example, All time shows Scale on a lower plan.
The period moves the finish rate and the course list. Tiles marked "all time" do not move.
Read the summary
- A sentence at the top sums it up, for example "12 of 40 students who started a course in the last 30 days have finished it." It adds Most started and Lowest finish rate courses, and Open your courses takes you to your courses.
- If nobody started a course in the period, it says so and offers Show 90 days.
- Your courses and past students are still there.
Five tiles sit under it:
| Tile | What it counts |
|---|---|
| Enrollments | Courses started in the period (or all time on the all-time view). |
| New students | Students who joined in the last 30 days. This one is always 30 days. |
| Finish rate | The share of students who started a course and finished it. |
| Quiz average | The average score over every quiz attempt, all time. |
| Certificates | Certificates awarded. |
Compare your courses
The Courses table lists your published courses with Started, Finished and Finish rate. Sort by Most started, Lowest finish rate or Name. A course nobody started in the period reads No one started in this period. Long lists show a few and Show N more courses.
Students in removed or unpublished courses sit in one Other courses row.
Lesson views and drop-off by lesson are not tracked, so they are not shown. The table is by course, not by student.
Check your quizzes
The Quizzes table lists your published quizzes with Attempts, Pass rate and Avg score. Each pass rate carries a tag: Most pass, Mixed or Most fail. A quiz nobody took reads No attempts yet. Results are all time.
Export CSV
Export CSV downloads the course analytics for the period you picked.
Find where students drop off
- Choose 90 days to get enough students.
- Sort the Courses table by Lowest finish rate.
- Open that course in Curriculum and shorten it, split it or add an example.
- Check Quizzes. A quiz tagged Most fail needs work, or the lesson before it does.
Questions
Why do I not see a Courses tab?
It appears when you have at least one course, or enrollments or certificates from courses you deleted. Create a course and it shows up.
Why is the page locked?
Course analytics is on the Pro plan. Starter shows what Pro adds and where to compare plans. Nothing you own changes.
Can I see progress for one student?
No. The tab shows totals by course and quiz, not by student.
Related
Part of Marketing and Analytics Guides · Product page: PersonaCart features